Sensor analytics platform
🗓️ 2017
During my time as a co-op at Bosch, I wrote a stack of applications providing sensor data storage, real-time monitoring, and historical analysis.
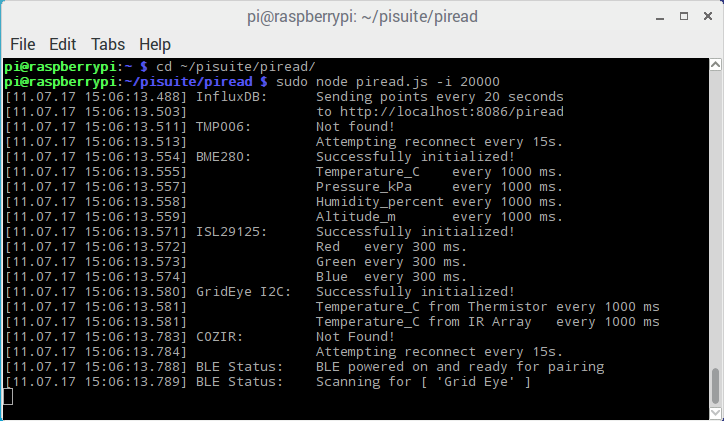
On the back-end, a Node.js script read sensor data from various interfaces, stored it to a time-series DB (InfluxDB), and forwarded it over a websocket. The script had a modular API for adding new sensor types.
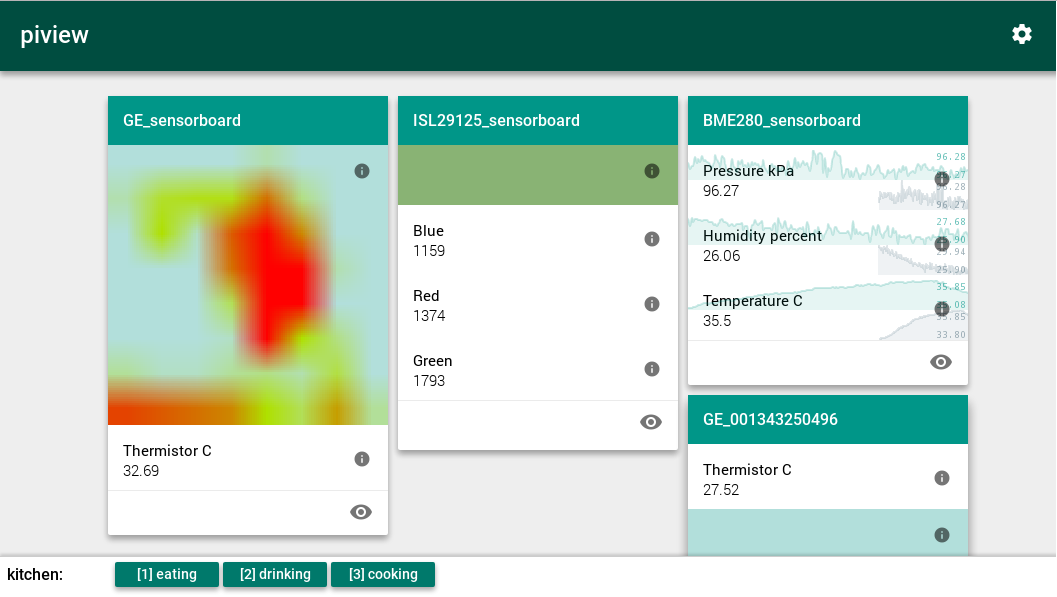
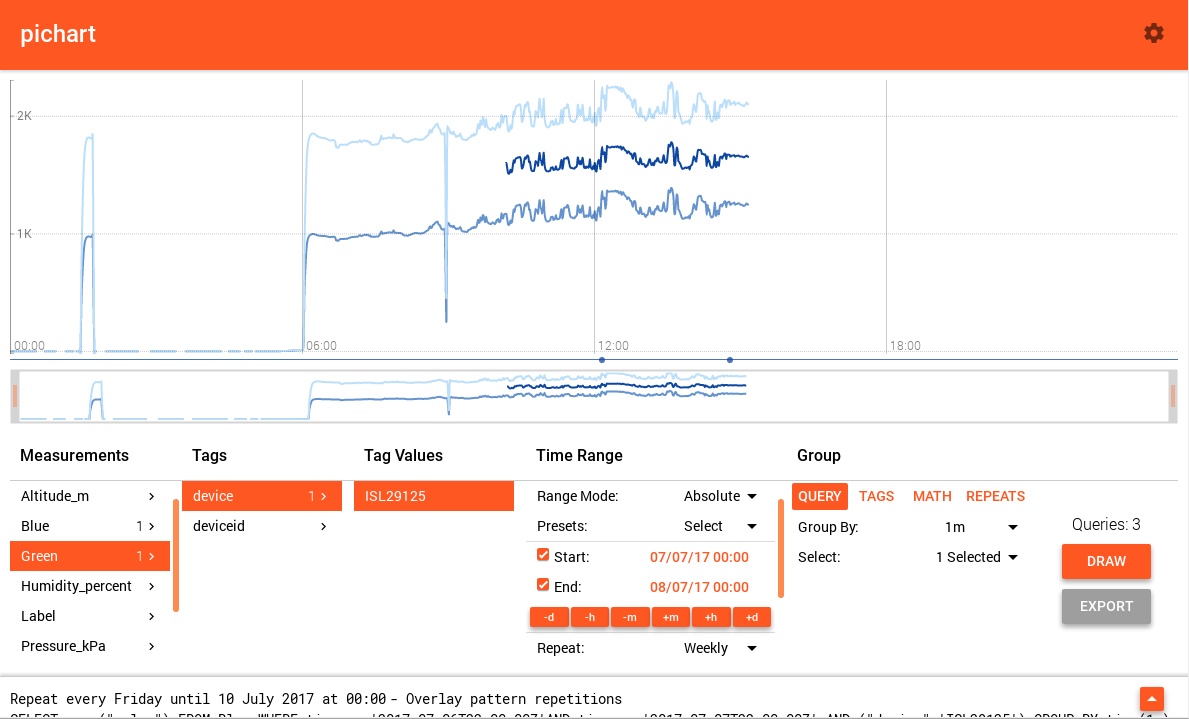
Two front-ends, written with jQuery, were used for displaying the data. One for viewing live data, and one for building queries and viewing historical reports.
This is how I started in hardware and accidentally ended up a web developer! I thought that co-op would be spent laying out PCBs and characterizing sensors and circuits. Instead, I stumbled into this. What a fortunate mistake.